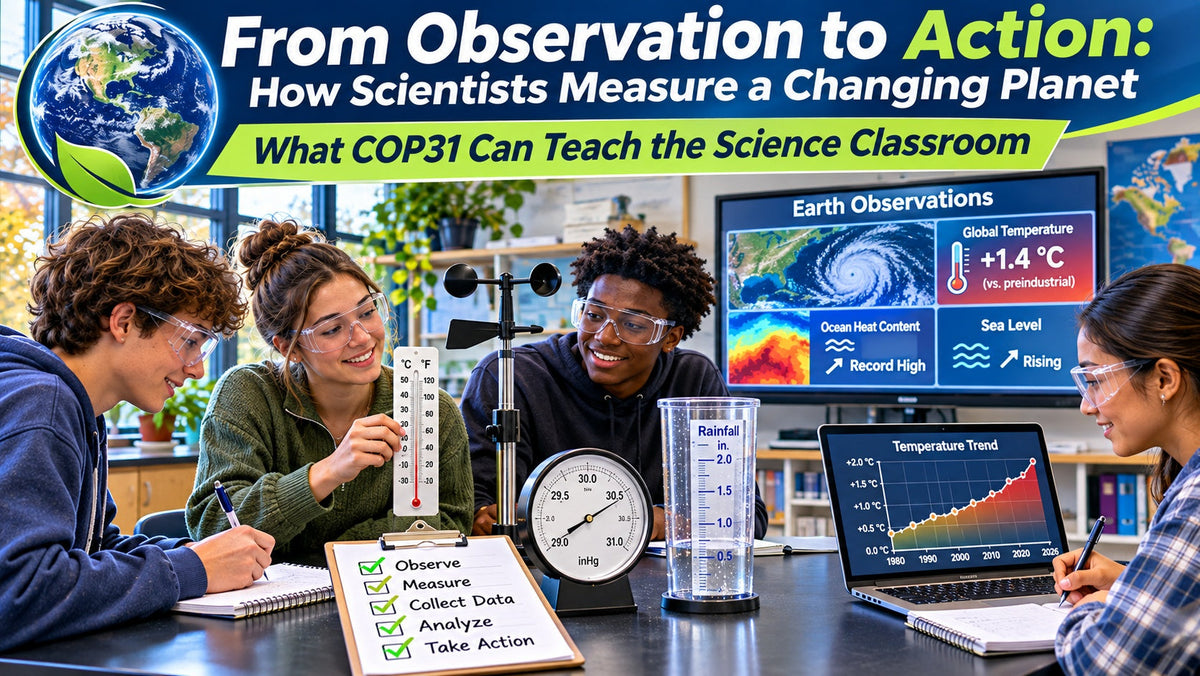
When scientists talk about changes in Earth's climate, oceans, atmosphere, or weather patterns, the conversation begins with something very familiar to a science classroom:
Measurement.
Temperature readings. Rainfall totals. Wind speed. Atmospheric pressure. Ocean temperatures. Greenhouse gas concentrations. Satellite observations. Measurements collected repeatedly over time.
Today, November 9, 2026, COP31 opened in Antalya, Türkiye, bringing countries together for the annual United Nations climate conference. The same day is also Earth Information Day, an international discussion focused on Earth observation and how scientific measurements can be used to understand changes in our planet.
For middle and high school science teachers, that creates a valuable classroom connection.
Students do not need satellites, research vessels, or global climate models to begin understanding how Earth science works.
They can start with a thermometer.
A barometer.
An anemometer.
A rain gauge.
A notebook.
And a question.
Big Earth Science Begins With Small Measurements
Global climate science can feel enormous.
Scientists examine oceans, glaciers, atmospheric gases, sea level, temperature patterns, weather systems, and interactions between multiple Earth systems.
But those large conclusions depend on individual measurements.
A scientist may measure the temperature of the ocean at one location.
A weather station records air temperature every hour.
A satellite measures characteristics of Earth's atmosphere or surface.
A tide gauge records changes in sea level.
One measurement alone tells scientists very little.
Thousands or millions of measurements collected over time begin to reveal patterns.
That idea is surprisingly easy to reproduce in the classroom.
Students can make a measurement today.
Then again tomorrow.
And the next day.
After several weeks, they no longer have a single observation.
They have a dataset.
Now they can begin asking deeper questions.
Is there a pattern?
Is the average changing?
Are some measurements unusual?
What variables might explain the differences?
How confident are we in the conclusion?
Those are the same types of questions scientists ask when working with much larger Earth observation datasets.
Weather and Climate Are Not the Same Thing
One of the most useful lessons students can learn from Earth observation is the difference between weather and climate.
Weather describes atmospheric conditions over relatively short periods of time.
Climate involves patterns observed over much longer periods.
A cold November morning does not tell us what is happening to global climate.
Neither does an unusually hot afternoon.
Individual observations matter because they become part of a larger record.
This distinction provides a useful opportunity to teach students how scientists avoid drawing conclusions from isolated data points.
Imagine that students record the outdoor temperature every day for one week.
They may notice warmer and cooler days.
That is weather data.
If they compare November temperatures across many years, they are beginning to examine a longer-term pattern.
The lesson is broader than climate science.
It teaches students something important about evidence:
Good scientific conclusions require enough data to identify meaningful patterns.
Start With a Classroom Weather Station
A simple school weather station can become one of the most versatile Earth science investigations available to teachers.
Students can collect measurements such as:
-
Air temperature
-
Wind speed
-
Wind direction
-
Atmospheric pressure
-
Precipitation
-
Cloud conditions
Instead of simply reading the instruments, students can record the information at the same time each day.
That consistency matters.
Students can then create a table or spreadsheet and begin comparing observations.
Questions might include:
How did atmospheric pressure change before a weather event?
Did wind speed increase or decrease during the week?
Which days experienced the greatest temperature change?
Do cloud conditions appear to correspond with temperature or precipitation?
How similar were student predictions to what actually occurred?
The investigation shifts the lesson from learning about weather instruments to actually using them to collect evidence.
Map Microclimates Around the School
Students can also investigate how conditions vary across a relatively small area.
Many school campuses contain several different microenvironments.
A sunny parking lot may be warmer than a shaded grassy area.
A location near a building may be protected from wind.
A paved surface may heat differently than soil.
Students can measure temperature at several locations around the school grounds.
They might compare:
-
Full sunlight
-
Shade
-
Grass
-
Pavement
-
Near a building
-
Open space
The class can then map the results.
Students may discover that temperatures measured only a few hundred feet apart are not identical.
Now the investigation becomes more interesting.
Why are the readings different?
What variables might be responsible?
Could surface material affect temperature?
Does shade make a measurable difference?
Would the same pattern appear at another time of day?
Students begin to see that collecting data is only the first step.
Science also requires explaining why patterns occur.
Turn One Measurement Into a Long-Term Dataset
Many classroom investigations happen during a single class period.
Earth science offers an opportunity to work differently.
Students can collect a small amount of data repeatedly.
A five-minute measurement taken every day may eventually become more useful than a complicated one-day experiment.
For example, students could record daily temperature and atmospheric pressure for six weeks.
At first, the data may seem random.
As the dataset grows, students can begin calculating:
-
Daily changes
-
Weekly averages
-
Highest and lowest measurements
-
Range
-
Differences between weeks
-
Relationships between variables
Students might graph temperature against time.
They could compare pressure readings with weather conditions.
They could identify unusual measurements and decide whether they represent real events or possible measurement errors.
This is an excellent way to demonstrate that scientific understanding often develops gradually.
Teach Students to Question the Data
Students sometimes assume that numbers automatically make a conclusion correct.
They do not.
Measurements can contain error.
Instruments can be used incorrectly.
Conditions can change unexpectedly.
Data can be incomplete.
A thermometer placed in direct sunlight may produce a different result from one properly positioned for air temperature measurements.
Two student groups may read the same instrument slightly differently.
An observation may be recorded at the wrong time.
These are not reasons to avoid collecting data.
They are reasons to teach students how to evaluate it.
Useful questions include:
Was the measurement collected consistently?
Was the instrument appropriate for the measurement?
Do repeated trials produce similar results?
Is one data point very different from the others?
Could another variable explain the result?
Would more data strengthen the conclusion?
This is where classroom measurement begins to resemble authentic scientific practice.
Compare Classroom Observations With Larger Data
Once students have collected their own measurements, teachers can introduce larger datasets.
Students might compare local weather observations with regional or national data.
They can examine historical temperature or precipitation information.
They can work with maps showing global or regional patterns.
The important part is the sequence.
Students first experience what it means to collect a measurement themselves.
Then they encounter a much larger dataset and understand that every graph and map ultimately represents observations collected somewhere.
That makes large Earth science datasets less abstract.
A graph is no longer simply a line on a screen.
It represents measurements.
What Scientists Are Measuring Right Now
The World Meteorological Organization reported today that 2026 is expected to be among the four warmest years on record. Its current climate update also points to record ocean heat and sea levels and warns that a strong El Niño could increase heat and extreme weather risks into 2027.
Those conclusions do not come from a single thermometer.
They come from observing Earth systems across many locations and over long periods of time.
That is the central scientific idea teachers can bring into the classroom.
Students do not need to begin by debating a conclusion.
They can begin by asking:
What was measured?
How was it measured?
How long was the data collected?
What pattern appears?
What additional evidence would help?
Those questions move the conversation toward science.
From Observation to Explanation
A strong Earth science lesson should not end when students finish the data table.
Students need to interpret what they collected.
Suppose a class records temperature at three locations around the school.
One location consistently shows higher temperatures.
Students should not stop at:
“The parking lot was hotter.”
Ask them to develop an explanation.
What evidence supports that conclusion?
Was it hotter every day?
How large was the difference?
Could surface material have contributed?
What other variables should be considered?
Would measuring at a different time change the result?
This process takes students through a useful progression:
Observe
Measure
Record
Compare
Analyze
Explain
That same progression appears throughout science.
A Strong NGSS Connection
Earth observation connects naturally with several NGSS Performance Expectations and Science and Engineering Practices.
MS-ESS2-5: Earth's Systems
Students are expected to collect data that provides evidence for how interactions of air masses result in changes in weather conditions.
A classroom weather station can give students direct experience collecting weather-related evidence rather than only reading about weather systems.
MS-ESS3-5: Earth and Human Activity
Students are expected to ask questions that clarify evidence concerning factors that have caused the rise in global temperatures over the past century. NGSS specifically identifies evidence such as temperature data, atmospheric gas measurements, graphs, tables, and maps.
This makes data literacy especially important.
Students need to understand how evidence is collected before they can evaluate what that evidence suggests.
HS-ESS3-5: Earth and Human Activity
At the high school level, students analyze geoscience data and results from global climate models to make evidence-based forecasts about climate change and impacts on Earth systems.
This directly reinforces the importance of analyzing and interpreting data.
HS-ESS2-4: Earth's Systems
Students also use models to describe how changes in energy flowing into and out of Earth's systems can result in changes in climate.
Together, these standards reinforce an important point:
Students should not only learn conclusions about Earth's systems.
They should understand how scientists reached those conclusions.
Earth Observation Is Also a Data-Literacy Lesson
The ability to read data is becoming increasingly important across science.
Students encounter graphs, charts, maps, models, and statistics constantly.
But reading a graph is not the same as understanding the evidence behind it.
Earth science gives teachers an opportunity to teach students how to ask:
Where did the data come from?
How many measurements were taken?
Over what period?
What does the scale show?
What pattern is visible?
Are there exceptions?
Does the graph support the conclusion being made?
These skills extend far beyond weather and climate.
Students will use them in biology, chemistry, physics, environmental science, and eventually in many careers.
The Role of Science Departments and Administrators
Earth observation can also provide a useful example for department planning.
Students are more likely to develop measurement and data-analysis skills when they have regular opportunities to use real instruments.
That means departments should consider whether students have access to appropriate Earth science and measurement tools.
Questions for department leaders might include:
-
Do students regularly collect weather or environmental data?
-
Are instruments available in sufficient quantities?
-
Can equipment be shared between Earth science, environmental science, and general science courses?
-
Are teachers able to conduct long-term investigations?
-
Do students have opportunities to graph and interpret their own measurements?
-
Could a small set of shared instruments support investigations across several grade levels?
These questions help connect purchasing decisions to actual instructional goals.
Equipment Should Help Students Generate Evidence
Go Science Crazy's current Earth Science collection includes classroom resources such as anemometers, barometers, cloud-forming equipment, compasses, and other tools for studying Earth's systems and atmosphere.
The important question is not simply which instrument is available.
It is what students can do with it.
An anemometer allows students to measure wind speed.
A barometer allows them to track atmospheric pressure.
A thermometer provides temperature data.
A cloud-forming demonstration can help students investigate atmospheric processes.
Used together with careful observation and recording, these tools allow students to participate in the same basic scientific process that underlies much larger Earth observation systems.
The scale is different.
The scientific thinking is not.
From the Schoolyard to the Planet
COP31 and Earth Information Day are global events.
The science behind them begins with something much smaller.
An observation.
A measurement.
A data point.
Then another.
And another.
Over time, those observations become patterns.
Patterns become evidence.
Evidence helps scientists develop explanations, build models, make forecasts, and inform decisions.
That progression is something students can experience directly.
A middle school student measuring wind speed outside the classroom is not operating a global observing network.
But that student is learning the same fundamental lesson:
If you want to understand how something is changing, you have to measure it.
That may be one of the most important science lessons today's global conversation can bring into the classroom.