“What kind of winter are we going to have?” It is a question students, teachers, meteorologists, and families ask every year. But how can scientists possibly make predictions about a season that has not happened yet?
They do not have a crystal ball. They have something much more useful: observations, measurements, historical patterns, computer models, and probability.
That makes this winter especially interesting for the science classroom. NOAA’s Climate Prediction Center reported in November that El Niño continues to strengthen, with strong to very strong conditions likely through January through March 2027. That does not mean scientists know exactly what the weather will be on any particular day this winter. It means they have enough evidence to identify patterns and calculate which seasonal conditions are more likely.
For teachers, that distinction creates an excellent opportunity to explore weather, climate, Earth systems, data analysis, probability, and scientific prediction with students.
What Is El Niño?
El Niño is part of a larger climate pattern called the El Niño Southern Oscillation, or ENSO. During El Niño, ocean temperatures become unusually warm across portions of the central and eastern equatorial Pacific Ocean.
That warming does not stay isolated in the ocean. The ocean and atmosphere interact, so changes in ocean temperature can affect winds, rainfall, atmospheric circulation, and eventually weather patterns in regions far beyond the tropical Pacific.
This is one of the reasons Earth science is so interconnected. A change in ocean temperature thousands of miles away can influence atmospheric circulation and alter the probability of certain weather patterns elsewhere.
Students do not need to understand every detail of atmospheric circulation before they can investigate the basic idea. They can begin with a simpler question:
How can changing conditions in one part of a system influence another part of the system?
That question appears throughout Earth science.
Why Does El Niño Affect Winter Weather?
The Pacific Ocean stores and transfers enormous amounts of heat. When ocean temperatures change across such a large region, atmospheric circulation can respond.
During a strong El Niño, changes in tropical Pacific conditions can influence the position and behavior of the jet stream. That, in turn, changes the probability of certain temperature and precipitation patterns across the United States.
The important word is probability.
Forecasts may suggest warmer conditions in one region or wetter conditions in another, but they do not guarantee what will happen in every city or on every day.
That is an important science lesson.
A Forecast Is Not a Promise
Students often think of a forecast as either right or wrong. If the forecast says rain and it does not rain at their house, they may conclude that the forecast failed.
Scientific forecasting is more complicated. Weather and climate forecasts often communicate probabilities based on current observations, historical data, and computer models.
Even during a strong El Niño, individual storms, cold snaps, warm spells, dry periods, and local variations will still occur. A seasonal forecast tells scientists what conditions are more likely, not what every individual day will look like.
This gives teachers an opportunity to introduce an important idea:
Science can acknowledge uncertainty while still producing useful, evidence-based predictions.
Classroom Investigation: Can Students Build a Winter Forecast?
Instead of simply telling students what El Niño might mean for winter, let them examine the evidence.
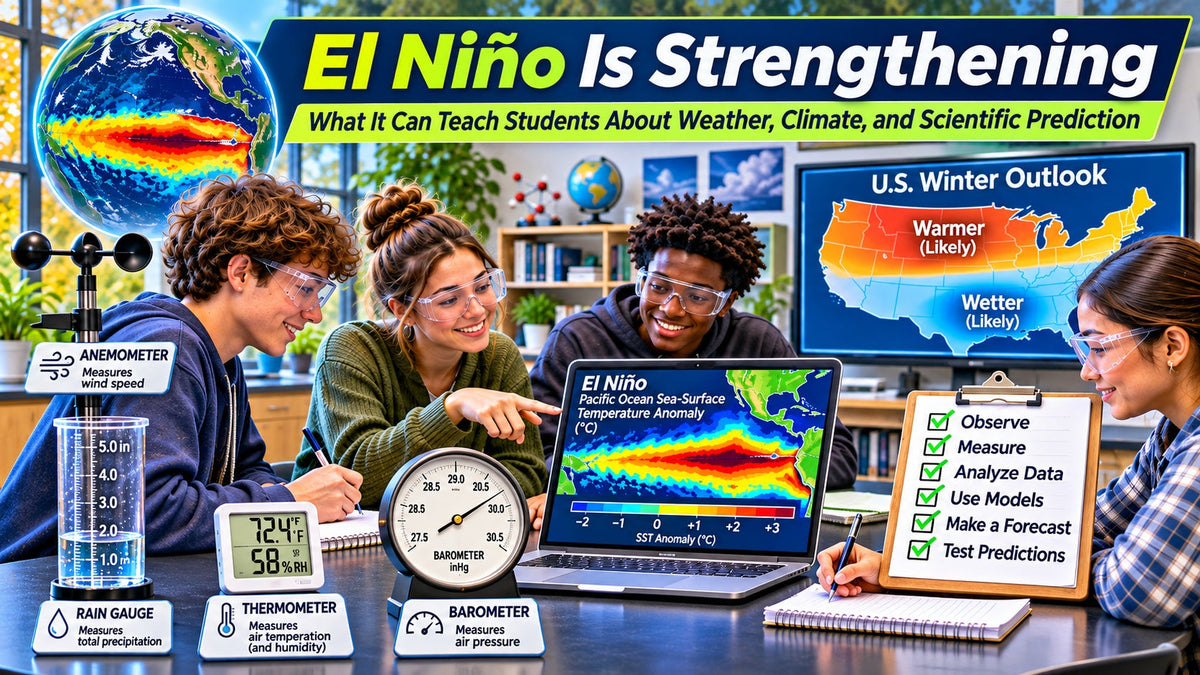
Provide students with a current El Niño sea surface temperature map, a U.S. winter temperature outlook, a precipitation outlook, historical El Niño winter information, and a map of the United States.
Then ask students to create their own winter forecast. They might identify regions more likely to experience above-average temperatures, areas more likely to see wetter conditions, places where the forecast is less certain, and which evidence influenced their predictions.
The goal is not for students to predict the winter perfectly. The goal is for them to support a prediction with evidence.
Useful questions include:
-
What information did you use?
-
Which data influenced your prediction most?
-
Where is the forecast strongest?
-
Where is there more uncertainty?
-
What additional information would improve your forecast?
Students are no longer simply reading a weather map. They are interpreting scientific information.
Start a Classroom Winter Weather Log
Students can also collect their own weather data throughout the winter. A class might record temperature, atmospheric pressure, wind speed, wind direction, precipitation, and cloud conditions.
The data collection does not need to take an entire class period. A few minutes several times each week can eventually produce a useful dataset.
Over time, students can graph the information and look for patterns. They might compare temperature changes, identify shifts in atmospheric pressure before weather events, track wind conditions, and compare local observations with the seasonal outlook.
Students can also revisit their original winter predictions later in the season. Prediction comes first, evidence comes later, and then students evaluate whether the evidence supported their expectations.
Turn Students Into Weather Detectives
Weather data becomes more engaging when students are given a problem to solve.
For example, give students several days of temperature, pressure, wind, and precipitation data and ask which day appears most likely to have experienced a storm.
Or provide weather information from several locations and ask students to identify where changing conditions suggest an air-mass boundary may be located.
Another option is to give students a seasonal outlook and actual observations collected later. Ask whether the observed conditions matched the forecast.
The answer may not be simply yes or no. Students may discover that some parts of the forecast were supported while others were not. That is exactly the type of evidence-based reasoning science classrooms should encourage.
Measure the Weather Instead of Only Reading About It
Students can learn what an anemometer does from a diagram. They can memorize that a barometer measures atmospheric pressure. They can define temperature.
But using those instruments creates a different learning experience.
A student watching an anemometer rotate begins connecting moving air to a measurable value. A changing barometer reading becomes evidence rather than vocabulary. A thermometer reading becomes a data point that can be compared with tomorrow’s measurement.
The value of weather instruments is not simply that students can operate them. Their value comes from what students can investigate with the measurements they produce.
Create a School Microclimate Investigation
Students do not need to wait for a major weather event to investigate atmospheric conditions. A school campus can contain several small microclimates.
Have students measure temperature at locations such as a sunny parking lot, grassy field, shaded area, area near a building, and open space exposed to wind.
Then ask students to compare the results:
-
Which location was warmest?
-
Which was coolest?
-
What factors could explain the differences?
-
Would the results be the same at another time of day?
Students may begin thinking about surface materials, sunlight, shade, wind, and heat transfer.
A global topic such as El Niño has now led to an investigation happening directly outside the classroom.
Compare Weather With Climate
El Niño also creates a useful opportunity to clarify one of the most commonly misunderstood Earth science concepts.
Weather and climate are not the same thing.
Weather describes atmospheric conditions over relatively short periods of time. Climate describes longer-term patterns.
A single snowstorm does not prove or disprove a seasonal climate pattern. Neither does one unusually warm afternoon.
Scientists identify climate patterns by looking at large amounts of data collected over longer periods. Students can practice this distinction by comparing today’s temperature with the average November temperature for their region, or this week’s rainfall with typical seasonal precipitation.
They begin to understand why one measurement cannot describe an entire system.
One Data Point Is Rarely Enough
El Niño forecasting reinforces another important scientific habit: repeated measurements matter.
Scientists do not determine El Niño conditions from one temperature reading. They monitor ocean temperatures, atmospheric circulation, winds, rainfall, subsurface ocean temperatures, and multiple climate indices. They also compare current observations with historical data and forecast models.
Students can apply the same principle on a smaller scale.
One temperature measurement tells them what the temperature was at that moment. Twenty measurements begin to reveal a pattern. Measurements collected over months provide even more information.
This lesson applies across every science discipline:
Repeated measurements strengthen evidence.
Let Students Work With Probability
El Niño forecasting can also bring mathematics naturally into the science classroom.
Suppose a forecast says there is a 70 percent probability of above-average temperatures. Ask students whether that means temperatures will be above average 70 percent of the time.
Not necessarily.
The probability describes the likelihood of a seasonal outcome, not the percentage of warm days.
This distinction can lead to discussions of probability, forecast confidence, statistical patterns, historical comparisons, uncertainty, and model predictions.
Students begin to see why scientists rarely communicate complex forecasts with absolute statements.
What Happens When Models Disagree?
Scientists do not rely on a single forecast model. Different models may produce slightly different predictions.
That can sound confusing to students, but it creates an excellent teaching opportunity.
Ask:
If two scientific models disagree, does that mean one must be useless?
Not necessarily. Models simplify complex systems. Different models may weigh variables differently or begin with different assumptions and observations.
Scientists compare models, examine how they have performed previously, and look for areas where several models agree.
This helps students understand what scientific models really are:
Tools for understanding and predicting systems, not perfect copies of reality.
NGSS Connections
This topic connects naturally with several NGSS Performance Expectations.
MS-ESS2-5: Earth’s Systems
Students collect data to provide evidence for how interactions of air masses result in changes in weather conditions.
MS-ESS2-6: Earth’s Systems
Students develop and use models to describe how unequal heating and Earth’s rotation produce patterns of atmospheric and oceanic circulation that determine regional climates.
HS-ESS2-4: Earth’s Systems
Students use models to describe how variations in energy moving into and out of Earth’s systems can result in changes in climate.
Relevant Science and Engineering Practices include:
-
Analyzing and Interpreting Data
-
Developing and Using Models
-
Using Mathematics and Computational Thinking
-
Planning and Carrying Out Investigations
-
Constructing Explanations
The important point is not simply to label an activity as NGSS related. Students should actually be using evidence, models, measurements, and scientific reasoning.
A Good Opportunity for Science Departments
El Niño does not need to be only an Earth science lesson.
Earth science students can investigate weather and climate. Physics students can examine energy transfer, convection, pressure, and fluid motion. Environmental science students can study how changing weather patterns affect ecosystems and communities. Mathematics can support graphing, averages, trends, and probability.
This creates an opportunity for department leaders to consider equipment that can support multiple courses instead of one isolated activity.
Weather instruments, thermometers, atmospheric pressure tools, and other measurement equipment can be shared across several classes and used repeatedly throughout the school year.
That is often where science equipment provides the greatest value.
Make the Forecast a Semester-Long Investigation
One of the most interesting ways to use the current El Niño event is not to finish the lesson in one